
AKRA Recorded 9M2024 Net...
25th Oct 2024

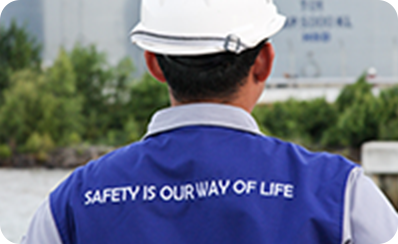
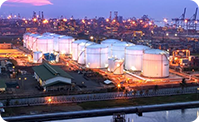
PT AKR Corporindo Tbk, a leading logistics and supply chain company, is engaged in the trading and distribution of Petroleum and Basic Chemicals with extensive network of liquid bulk and dry bulk storage, transportation facilities, and port operations.
In the middle of high logistics cost in Indonesia, PT AKR Corporindo Tbk offers innovative and cost-efficient logistics and supply chain solutions. AKR is ready to support industrial development in Indonesia and is now developing large Integrated Industrial Estate and Port Facilities in East Java which will provide logistics, energy, and infrastructure solutions to Industries investing in Indonesia.
AKR is committed to continuously growing in a sustainable manner to create value for all stakeholders.
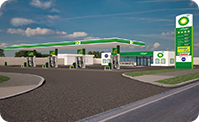
PT AKR Corporindo Tbk has built a solid track record over six decades serving a wide range of customers in Indonesia. Beginning with the establishment of AKR, focusing on logistics and supply chain services for petroleum and basic chemicals, over time this has developed into a logistics network through retail, aviation petroleum, and more.
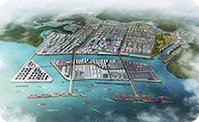
Supported by competitive advantage, AKR has progressed with JIIPE Special Economic Zone in Gresik, East Java, playing a crucial role in an integrated supply chain ecosystem offering multimodal transportation, deep-sea ports, and interconnectivity and competitive utilities such as gas and other renewable energy sources. This aligns with AKR’s strategy of integrating competitive advantages in logistics infrastructure and sustainability initiatives. In addition to supporting the national industry, JIIPE can also attract direct foreign investment.
AKR’s business transformation demonstrates a clear vision, strong leadership, sustainable resilience, and adaptability in business dynamics, capturing momentum and business opportunities that can drive new growth and foresee downstream trends in Indonesia, boosting future economic growth. Besides the utilities and world-class facilities provided by JIIPE, JIIPE has potential further benefits to AKR distribution business.
In practice, AKR also strives to conduct its business responsibly by prioritizing Environment, Social, and Governance (ESG) principles, to create a positive impact for all stakeholders.
These steps have led AKR to consistent growth, evidenced by net profit in 2023 reaching Rp2,780 billion, a 16% increase. Growth over the past five years has been driven by a strong business model, with AKR at the forefront of all aspects of business with strong financial management, adequate infrastructure, comprehensive information technology, and reliable human resources. In new level of growth optimistic about driving business progress across various industries, potentially becoming a trendsetter for Indonesia’s future economic growth.


An overview of AKR’s current financial situation across all of its key performance indicators.
→ Continue Reading
More information about our company’s history, corporate value, and performance.
→Continue Reading